PCoIP Troubleshooting – Part 2
Welcome to Part two of my PCoIP Troubleshooting series. In this part I will be looking again at the PCoIP Log Viewer, but this time I will be focusing on the Real-Time/WMI graphs, what they are, what they mean and how they might indicate what’s happening on your environment.
I will be referring back to PCoIP Troubleshooting – Part 1 from time to time, so I’d recommend you visit that page first and familiarise yourself with all of the graphs and counters that are available from the PCoIP logs.
PCoIP Log Viewer – Real-Time/WMI Stats User Guide
Before we can do anything we need to get the PCoIP Log Viewer to be able to display the Real-Time WMI counters. There are few pre-requisite steps that you’ll need to follow, these steps can be found here.
To view Real-Time states, you have two options, either run the PCoIP Log Viewer on the VM itself or run it remotely. To remotely connect to another VMs PCoIP Real-Time stats, you must ensure that you allow DCOM through the firewall otherwise it will fail.
To open a new Real-Time session:
- File > New Connection
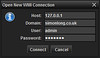
- Host: Enter the VM IP or Hostname.
- Domain: Domain of the user account used to connect to the session
- Username: Username of the user account used to connect to the session
- Password: Password of the user account used to connect to the session
If connection fails, check your user/pass. If connection still fails check the required pre-requisite step which can be found here.
Multiple Real-Time Sessions
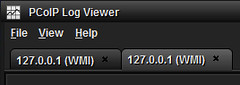 You can have more than one Real-Time PCoIP session open in the Log Viewer. Just follow the steps above to open a second, third, fourth…..session. For each session you have open you will get an additional tab at the top of the Log Viewer which will allow you to flick between sessions.
Saving Real-Time Session Data
Once you have finished your session, you have the opportunity to save that session data allowing to revisit it at any point. Just close the session tab and you’ll be asked if you’d like to save the session.
Opening Saved Session
Following on from the steps above, to open a saved session:
- File > Open Session
- Select the saved session
Multiple Real-Time sessions and Log Views
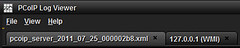 Even thought you are currently viewing Real-Time PCoIP stats you can still open normal PCoIP Log files into the Viewer and view them side by side. They open into a new tab as you would expect.
- File > Open Log
- Select the PCoIP Log .xml
PCoIP Log Viewer Interface

Lets start of by taking a look at the control bar at the top of the graphs.
- Refresh – time period when data is collected
- Then/Pre-Now/Now Slider – Allows you to go back in time to see what happened X amount of time ago (AKA WMI-Rewind)
- Small/Large Slider – Allows you to effectively Zoom out to see a large period of time on the screen (Max – 60 mins)
 Here is an example of the Small/Large Slider. As you can see all of the stats are squeezed down into one window. This is very useful when you are scanning over long sessions investigating an issue.
Session Statistics

At the bottom of the Real-Time Viewer we have some session statistics as shown above. These stats are only of the current session.
Note: The Client Address field is broken and in the process of being fixed.

When you use the Then/Pre-Now/Now Slide to view a period back in time you’ll notice that all the numbers go yellow and stopped incrementing. You’ll also notice that as you scroll back in time these numbers will also follow you back to show you the session statistics at that specific point in time.
PCoIP Real-Time Performance Data
Below the control bar are 7 performance graphs displaying live data. The graphs in this view aren’t necessarily ordered in order of popularity. The graphs at the top might not be the graphs that has the information you are interested in as with the static graphs produced by the PCoIP Logs.
Note: The value Tx stands for transmit, and this data getting sent from the server to the End-Point (Thin Client etc), Rx stands for received and this is data being received by the server from the End-Point.
Tip: To Zoom in to a specific section of the graph, click on the graph and holding the mouse button down drag the cursor to the Right and cover the section you’d like to view. To Zoom out click on the graph and holding the mouse button down drag the cursor to the Left this will Zoom back out to the normal view.
PCoIP Server Process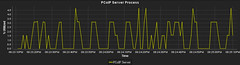
The PCoIP Server Process graph displays the following counter:
- PCoIP Server (CPU consumption of the PCoIP server process) – You may see 100% values when using very high screen resolutions or high frame rates.
If your virtual machine is undersized and using 100% of it’s CPU you may find image quality being effected. This is due the PCoIP Server Process getting less time on the CPU as it would normally. Keep an eye for high values here as you may find your virtual machine’s CPU is the bottleneck.
You can also see this if you look at the Processes running on the virtual machine, you’ll see a process called pcoip_server_win32.exe.
Bandwidth By Class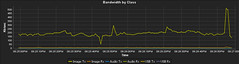
The Bandwidth By Class graph displays the following counters:
- Image TX (Image data that is actually being sent from the virtual desktop to the client (kBytes/s)
- Image RX (Image data that is actually being sent from the client to the virtual desktop (kBytes/s)
- Audio TX (Audio data that is actually being sent from the virtual desktop to the client (kBytes/s)
- Audio RX (Audio data that is actually being sent from the client to the virtual desktop (kBytes/s)
- USB TX (USB data that is actually being sent from the virtual desktop to the client (kBytes/s)
- USB RX (USB data that is actually being sent from the client to the virtual desktop (kBytes/s)
Total Bandwidth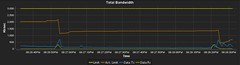
The Total Bandwidth graph displays the following counters:
- Limit (Displays the hard limit) – This can be set in the PCoIP.adm GPO under “Maximum PCoIP session bandwidth”
- Act. Limit (The actual limit PCoIP think it has)
- Data TX (Total data that is actually being sent from the virtual desktop to the client (kBytes/s) – Image + Audio + USB
- Data RX (Total data that is actually being sent from the client to the virtual desktop (kBytes/s) – Image + Audio + USB
You’ll tend to see the Act. Limit value will fluctuate depending on the amount of bandwidth PCoIP needs or can get and also depending heavily on networking conditions. If packets are being received in the right order and there is little-to-no packet loss, you’ll probably see the Act. Limit increase. This will also happen in reverse, if there is heavy packet loss, the Act. Limit will decrease to reduce the rate at which packets are being sent.
Connection Quality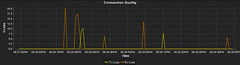
The Connection Quality graph displays the following counters:
- TX Loss (Any packet loss between the virtual desktop and the client)
- RX Loss (Any packet loss between the client and the virtual desktop)
Pixel data will become flagged as Loss or “Dropped” if that data, or that area on the screen arrives after newer pixel data has already arrived. Some pixels my also just not arrive, in which case they will be flagged as Loss.
You will often see a strong pattern of packet loss seen in this graph when there is bandwidth throttling (Act. Limit) seen in the Total Bandwidth graph. The throttling is invoked to reduce the amount of packets being sent. This in turn should help reduce the amount of dropped packets. Once the amount of Loss decreases you’ll likely see Act. Limit increase again.
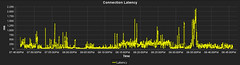
Connection Latency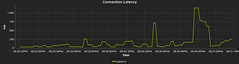
The Connection Latency graph displays the following counter:
- TX Loss (Overall connection latency) – Basically ping response time
Encoder Stats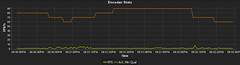
The Encoder Stats graph displays the following counter:
- FPS (Frame Per Second) – Display data frame update rate
- Act. Min Qual (actually aligns to the PCoIP maximum image quality set in the PCoIP.adm GPO under “PCoIP image quality levels”)
If the value of Act. Min Qual will drop lower than the value set in the GPO if you see packet loss.
Decoder Stats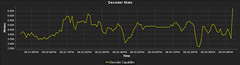
The Decoder Stats graph displays the following counter:
- Decoder Capacity (Decode rate) – This will show how well the client end-point is able to received the data that is being sent to it.