PCoIP Troubleshooting
I don't think it wouldn't be a bold statement for me to say that "out of the box" Teradici's PCoIP display protocol can perform flawlessly on a LAN or High-Speed WAN environment. However this may not always be the case and certainly over slow remote WAN links PCoIP can present a poor user experience. (Equally, so can any other remote display protocols)
Due to the nature of VDI, remote offices with low bandwidth, high latency connection are all to familiar. Initially performance is often poor and occasionally unusable. It's at this point you can throw in the towel and declare that VDI is not for your business OR you can try to workout what is causing the poor performance and try to improve it.
So where do you start?
PCoIP Log Viewer
The best way to to find out exactly what is causing the problems is by analyzing the PCoIP logs which are stored on each virtual desktop with the PCoIP Log Viewer. The PCoIP Log Viewer is a great tool created by a guy within VMware – Chuck Hirstius. A guide on how to install and parse PCoIP log files can be found here.
The PCoIP logs can be found:
- XP – C:\Documents and Settings\All Users\Application Data\VMware\VDM\logs
- Win7 – C:\program data\application data\VMware\VDM\logs
The log files we will use to troubleshoot with are the logs named: pcoip_server_<year>_<month>_<day>_<sequential number>.txt
Before the logs can be opened into the Log Viewer they need to be parsed using the pcoip_parser.exe. Below is an example command used to parse the PCoIP logs into XML format.
C:\> pcoip_parser.exe "C:\program data\application data\VMware\VDM\logs" "C:\Parsed Logs"
Once we have parsed the PCoIP logs into an XML format we can now open the logs into the PCoIP Log Viewer. In the Log Viewer console we have four tabs, Server, Network, Options and Displays.
Server Tab 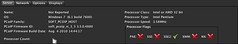
Most of the Server Info tab is self explanatory. The Processor type, is the processor for the virtual machine.
Network Tab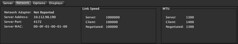
Link Speed – Keep an eye on the Negotiated value. This value will show you the maximum speed. You may see the Server or Client values higher, but for obvious reasons the negotiated value will always equal the lowest. E.g. Server = 1,000,000, Client = 10,000, Negotiated = 10,000. This could indicate that the Client is only on a 10Mbit network, whereas the server is using 1Gbit.
MTU – Same situation as link speed, keep an eye on the Negotiated speed rather than Server or Client.
Options Tab 
This tab will display any configuration parameters that are overriding from the default settings. E.g changes to Max FPS, Max Bandwidth Session Limit etc.
Displays Tab 
Image quality shows Min – Max Image Quality current set. This can be changed via the pcoip.adm.
PCoIP Performance Data
Below the tabbed information boxes there are 10 different graphs showing various different PCoIP performance data. I'll take you through them one at a time and explain to you what each value means and what is good or bad. The graphs have been ordered in order of popularity. The graphs at the top are more likely going to be the graphs that has the information you are interested in.
Note: The value Tx stands for transmit, and this data getting sent from the server to the End-Point (Thin Client etc), Rx stands for received and this is data being received by the server from the End-Point.
Tip: To Zoom in to a specific section of the graph, click on the graph and holding the mouse button down drag the curser to the Right and cover the section you'd like to view. To Zoom out click on the graph and holding the mouse button down drag the curser to the Left this will Zoom back out to the normal view.
PCoIP Bandwidth Utilization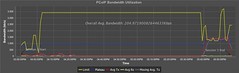
The PCoIP Bandwidth Utilization graph, shows you the following statics:
- Limit (The maximum allowed transmit rate (kBytes/s))
- Plateau (The theoretical bandwidth that the user could ideally use (a combination of user activity – display, USB, audio and other virtual channel as well as the network bandwidth available))
- Avg Tx (Shows how much bandwidth is actually being used from the virtual desktop to the client (kBytes/s)) – Probably the value you be most interested in. This will show you how much bandwidth is being used by that End-Point.
- Avg Rx (Shows how much bandwidth is actually being used from the client back to the virtual desktop (kBytes/s))
- Moving Avg. Tx
The graph also displays the Overal Average Bandwidth for the entire segment. In the screenshot the Avg Bandwidth is 205Kbps.
PCoIP Bandwidth Rate Limiting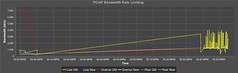
This PCoIP Bandwidth Rate Limiting graph shows you any adjustment PCoIP had to make to the bandwidth due to congestion.
- Loss Old (Old bandwidth limit value before it was decreased by PCoIP)
- Loss New (Value PCoIP reduced the bandwidth limit to)
- Overrun Old (Transmit rate the server was transmitting to the client)
- Overrun New (Transmit rate that PCoIP has throttled itself down to to make sure less packets are dropped)
- Floor Old (Bandwidth floor PCoIP thought it had)
- Floor New (Bandwidth floor after PCoIP had to throttled itself to down to)
Loss Old/New – is displaying changes in the available bandwidth limit. Loss Old displays the previous bandwidth rate and Loss New displays what the bandwidth rate has been reduced to. Loss (Reduction in the bandwidth limit) can be caused by lost packets that were sent by the server but never received by the client. PCoIP reduces the bandwidth limit in order to slow down the amount of packets being sent to try and stop the loss of packets.
Notes: When there is no packet loss, PCoIP will increase the available bandwidth. The increase in available bandwidth is not reflected in the PCoIP logs. PCoIP packet loss does not always correlate to Network packet loss.
Overrun – generally means the server was transmitting data at a higher rate than the client can receive at, possibly due to a constrained network environment. The graph will shoe the Old rate and the rate PCoIP has decided to change the transmit to (New).
Bandwidth Floor specifies a lower limit, in kilobits per second, for the bandwidth that is reserved by the PCoIP session.
PCoIP Connection Quality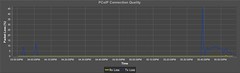
The PCoIP Connection Quality graph shows you information about dropped packets. (Note: PCoIP packet loss does not always correlate to Network packet loss.)
- Rx Loss (Received packets dropped)
- Tx Loss (Sent packets dropped)
Pixel data will become flagged as Loss or "Dropped" if that data, or that area on the screen arrives after newer pixel data has already arrived. Some pixels my also just not arrive, in which case they will be flagged as Loss.
You will often see a strong pattern of packet loss seen in this graph when there is bandwidth throttling (Loss New) seen in the PCoIP Bandwidth Rate Limiting graph.
PCoIP Packet Counts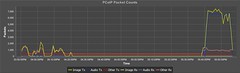
The PCoIP Packet Counts graph does literally show you how many packets are being sent/received for that given period of time. Packets are broken down into three categories, Image packets, Audio packets and "Other" (Other can be another other than Image or Audio packets. So things like USB, Printer or Scanner packets). Generally you would focus more on the Tx packets as this is the packets going from the Server to the End-Point.
- Image Tx (Image packets sent)
- Audio Tx (Audio packets sent)
- Other Tx (Other packets sent)
- Image Rx (Image packets received)
- Audio Rx (Audio packets received)
- Other Rx (Other packets received)
High packet count can often correlate with high packet loss (Tx Loss) seen in the graph above.
PCoIP Connection Latency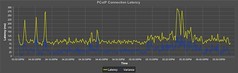
- Latency (Basically PING response times)
- Variance – is a measure of how far the Latency values are spread out.
PCoIP Encoder Stats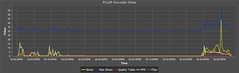
The PCoIP Encoder Stats graph is useful when you are optimizing PCoIP.
- Slices (PCoIP data (slices in UDP datagrams) – This should usually be very low. If you see this really high, there is a good chance you either have a network issue or a client issue.
- Max Slices
- Quality Table – The lower the number = the higher the quality or less BTL (Build To Lossless). Typically 0-2 is good.
- FPS(Frames Per Second) – Display data frame update rate
- Flips (How many samples from the video frame buffer are being taken per second. Default 30 FPS.)
When looking at the high Quality Table values, you will often see a correlation with a large amount of packets being send with high packet loss and rate limiting. when looking at areas of low Quality Tables values, this will often coincide with a small amount of packet transfer, smaller amounts of packet loss and less rate limiting.
Using the PCoIP Encoder Stats you can often identify opportunities to drop the frame rate which can help reduce overal bandwidth consumption.
PCoIP Encoder Stats – Changed Pixels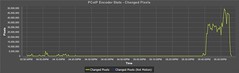
- Change Pixels – How many pixels have changed in the last 30 seconds
- Change Pixels (Not Motion)
PCoIP Encoder Stats – Delta Bits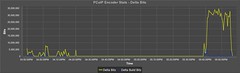
- Delta Bits (Overal amount of data packets)
- Delta Build Bits (Amount of Build To Lossless data packets)
Anytime you see a high Delta Build Bits value, you will probably also see a lower Quality Table value on the PCoIP Encoder Stats graph.
PCoIP Encoder Stats – Encoder Performance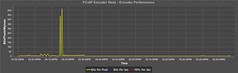
- Bits Per Pixel (How much PCoIP compression is happening) – The lower the value the more compression is being made.
- Bits Per Sec
- MPix Per Sec
PCoIP Encoder Stats – Client Performance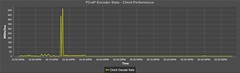
- Client Decode Rate
If the Client Decode Rate is always less that the Avg Tx found in the PCoIP Bandwidth Utilization graph, this may indicate that you have a Client problem or the client isn't powerful enough to decode the PCoIP data has its being received.
Analyzing PCoIP Data On The Graphs
Ok, now you know what most of the values on the graphs mean, lets take a look at how we can interprut what we see on the graphs to what problems might be causing poor performance.
For this analysis example I will be using the PCoIP data captured from a WAN connected desktop.
Exhibit (Best opened in a popup windows so you can flick between this screen and the graphs. Remember to allow Popups)
| Graph Analyzed | Value | Observations | Conclusions |
| PCoIP Bandwidth Utilization | Limit | Before 5:40 it was 3.5Mbps after which it dropped to 1.25Mbps. | Bandwidth Limit has almost been halved, possibly reduced by Rate Limiting |
| Avg Tx | Increase from practically nothing to 1.25Mbps | Data transmitted from the server to the client has increase from nothing to a value almost equal to the limit. | |
| Bandwidth Rate Limiting | Loss Old/New | Was a steady 3Mbps then suddenly drop down to 0.5Mbps, then peaked/dropped between 1Mbps and 3Mbps | Around the same time data transmission started (PCoIP Bandwidth Utilization graph) Loss reductions were seen instantly. It is worth noting that at the same time as the Loss reduction and the Limit getting throttled down there was a large spike in Tx Loss (Connection Quality graph). |
| Connection Quality | Tx Loss | Went from zero % loss to 45% loss in a spike and then stayed between 5-10% loss | A high amount of Packets being dropped/lost. This would probably cause the Bandwidth Limiting seen above. |
| Rx Loss | Remained zero | All data was being transfered, very little data was being sent back to the server | |
| Packet Count | Image Tx | Value increased very quickly and remained high | A massive amount of Image packets being transmitted could be due to a user making a lot of changes on the screen or watching a video |
| Audio Tx | Value increased very quickly and remained high | A massive increase in audio packets could indicate either streaming audio or audio from a video. Due to the high amount of image packets seen at the same time, this could indicate a video being watched. | |
| Connection Latency | Latency | Stay the same | Network Latency remained constant indicating there wasn't any bottlenecks or over-contention |
| Encoder Stats | Slice | Went from zero and peaked to 45 | A high Slice value could indicate poor network conditions or issue with the client. In this case it could be caused by bandwidth throttling. |
| Quality Table | Went from zero and hovered between 1 and 3 | This high value could be related to packets being lost | |
| FPS | Increased from zero to around 5. | Frame update rate increase possible due to many screen changes or video | |
| Encoder Stats – Encoder Performance | Bits per Pixel | Stayed below 1 | This shows that compression was still performing fine |
| Encoder Stats – Change Pixels | Changed Pixels | Went from 0 to 50,000 | High pixel change rates are often caused by videos or fast screen changes |
| Encoder Stats – Delta Bits | Delta bits | Went from 0 to 35,000,000 Bits | A high rate of screen changes causing a large amount of Bits being sent |
| Delta Build Bits | Went from 0 to 5,000 Bits | Only a small amount of build to lossless going on. This could indicate quick changing screens that don't allow time for full build to lossless or enough bandwidth to satisfy Maximum Image Quality without the need for BTL. |
Summary
By looking at the graph we able to deduce the following:
- At 5:40pm ImageTX and AudioTX Packet Count shot up. Often a large spike in both image and audio is observed when playing video's. We also saw the same patten with the Delta Bits, however the Delta Build Bits stayed relatively low in comparison. This would also indicate the viewing of a video or extremely quick screen refreshes which don't allow enough time for Build To Loss-Less.
- At exactly there was a massive peek in Packet Loss . PCoIP Packet Loss often occurs when packets arrive either late or out of order. If a packet is late due to contention on the network PCoIP will drop the packet as it is no longer required.
- Moments after the massive spike in Packet Loss the PCoIP Bandwidth Limit is throttled down. If the Bandwidth Limit is reduced the server will send the packets a slower rate, this often happens to help reduce Packet Loss.
